


Rahne Eric, B.Sc. in Electrical Engineering, founder of PIM Professional Industrial Measurement Technology Ltd., certified thermal imaging expert (Thermograph Level 3), forensic expert
Thermal imaging is now present in almost every profession. We are currently experiencing the most rapid spread of this non-contact temperature measurement method, but at the same time, the most severe professional devaluation. Some thermal camera manufacturers and distributors have stooped to the level of labeling 80x60 pixel smartphone accessories (and similar products) as professional thermal cameras without radiometric capabilities (as if we were to upgrade a VGA webcam to a professional video camera). Furthermore, it is disheartening that anyone who buys such a cheap device immediately calls themselves a thermographer, without any professional training (and often without even basic knowledge of physics and metrology)!The presentation (and article) - provides a minimal insight into the incredible versatility and theoretical and practical limitations of thermography, drawing from Rahne Eric's 650-page specialized book titled "THERMOGRAPHY - theory and practical measurement technology." Some thermal camera manufacturers and distributors have stooped to the level of labeling 80x60 pixel smartphone accessories (and similar products) as professional thermal cameras without radiometric capabilities (as if we were to upgrade a VGA webcam to a professional video camera). Furthermore, it is disheartening that anyone who buys such a cheap device immediately calls themselves a thermographer, without any professional training, and often without even basic knowledge of physics and metrology (and consideration)! In our upcoming series of articles, we aim to provide insight into the incredible versatility and theoretical and practical limitations of thermography, drawing from Rahne Eric's 650-page specialized book titled "Thermography - theory and practical measurement technology." The first parts will focus on the inspection of electrical distribution, switchgear, and control cabinets.
Taking thermal images, i.e., thermography, is an extremely versatile measurement method, while the user-friendly operation of modern thermal cameras can be compared to that of common digital video cameras. However, this simplicity should not deceive anyone: proper theoretical and professional knowledge, experience, and thorough measurement preparation are necessary to capture correct thermal images from a measurement perspective. Since we have already covered the theoretical foundations of thermographic measurements in previous issues of VL, we will now detail the most important measurement requirements and practical knowledge for the thermal inspection of electrical equipment. To draw attention, we will also present the impact of some common thermal camera operator errors on the accuracy and credibility of measurements.
As wide as the possibilities are with the preferably regular application of thermography in organizing the maintenance of electrical equipment, just as many difficulties arise during the implementation of measurements. Here we present some significant problems, along with advice on minimizing the extent of measurement errors. The biggest problem arises from the material of the measurement object itself. One common fault in electrical equipment is caused by the inadequate conductivity of contacts based on screw, spring, or crimped connections. Although increased transient resistance leads to contact heating proportional to the load, the small emissivity of metallic, mostly polished surfaces results in minimal heat radiation. Therefore, while detecting contact heating with thermal imaging tools is possible, precise measurement is almost impossible. Similarly challenging is measuring on rail systems without insulation. Here, the metallic surface of the object to be measured causes an almost immeasurable measurement error due to its low emissivity. The low emissivity of the surface of objects with non-visible properties is associated with a high reflectivity factor, so our measurement activities must be organized in a way that minimizes the resulting measurement error. It is important to pay attention to this during the measurement itself, as post-correction is practically impossible due to the heterogeneous environment caused by industrial conditions in the direction of the reflected heat radiation source. Our first task is to strive for a measurement setup with as homogeneous environmental temperature as possible. This requires a measurement setup where there are no strong heat sources operating in the direction of the radiation reflected by the object during the measurement, such as a heater, radiant hall heating, high-temperature technology, or other point- or line-shaped interfering radiation sources. Anything that cannot be temporarily shut down should be eliminated by using a different measurement or observation angle. If this does not provide a solution, then shield it with a screen or other shading surface, but in a way that does not reach the interfering heat radiation source and does not pose a fire hazard. The overzealousness of the local electrician who often accompanies the thermographer falls into the same category. While one switchgear row is being surveyed, they already open the doors of the switchgear row behind the person conducting the measurement. From this point on, instead of the almost homogeneous reflective surface temperature provided by the doors of the switchgear row, the inhomogeneous, location-dependent varying heat radiation of the electrical elements in the cabinets will be reflected on the measurement object! Now comes the coup de grâce in the reflection problem. Both the person conducting the measurement and their companion, as well as the observers, all act as interfering radiation sources causing reflective heat effects! We cannot send ourselves out of the field of view, but we can send the companion and observers away. We need to come up with something to eliminate the heat radiation caused by our bodies. The solution is to perform the measurement on the object surfaces at an angle of 70 ... 80° instead of at a 90° angle, where no other interfering heat source is reflected during the measurement from this angle, the task is already solved.

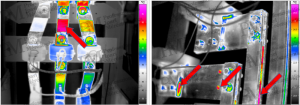
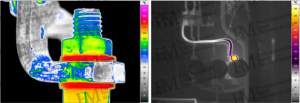
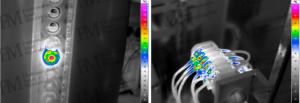
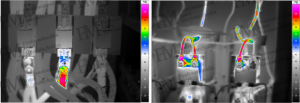
However, if we discover heat effects in the captured thermal image that seem suspicious for reflection, we should change our measurement position and repeat the thermographic recording from a different observation angle. If the location of the suspected reflective heat effect changes, then it is indeed a case of actual reflection. In such situations, we need to search for a "third" observation direction to prevent reflection from influencing our measurement. If this is not possible, we should make a note of the reflection for later documentation in our measurements. On the other hand, if changing our position and observation angle does not alter the depiction of the heat effect in the thermal image, then it is a real - object-related - heat effect. Due to the mostly polished surfaces of contacts, besides misleading reflections, the poor detectability of real object temperatures poses problems. Fortunately, there are usually some labeled, painted, or insulated surfaces that also heat up due to the heat generated at the fault location, thanks to the good heat conduction of electrical conductors. Existing holes in busbars can also be helpful. If they have a depth at least four times their diameter, due to the multiple reflections occurring inside them, we can measure radiation corresponding to nearly 100% emissivity. This applies to through holes, threaded holes, or gaps between two busbars as well (Images 5-6).
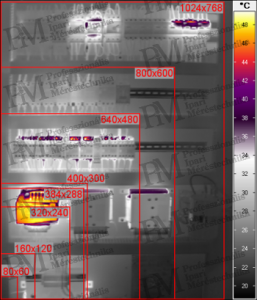
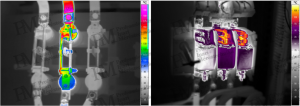
Another significant problem is related to the geometric resolution of thermographic measuring equipment. Due to the importance of this topic, I believe it is necessary to mention it in more detail here. It is common to hear about a comprehensive thermographic survey of an entire switchgear with a subsequent detailed fault location survey based on the overview thermal image. This sounds like a very efficient work process, which is true only if the geometric resolution requirement was adhered to during the overview image capture. Violating this requirement will leave unnoticed heat effects indicating problems with smaller wires and contacts. Detailed thermal images would likely not be taken, meaning that the faults would not be detected. In summary: capturing overview thermographic images with inadequate geometric resolution is simply unacceptable, and there are no exceptions to this rule. Fortunately, it is quite simple to determine the minimum object dimension measurable from a given distance in terms of the angular resolution (IFOV) expressed in mrad for the thermal camera (or its lens) specifications. For example, a 1.5 mrad geometric resolution means that each individual measurement spot assigned to a pixel at a distance of 2 m corresponds to a size of 3 mm. Now we just need to ensure that this measurement spot is entirely located on the object being measured. If this is not adhered to, the measurement spot may include radiation from the object's surrounding area. Since averaging occurs within the measurement spot, due to the temperature of the surrounding area, the measurement result may no longer represent the actual temperature of the object. As the position of the individual measurement spot corresponding to each pixel on the object is unknown, we need mathematics to help us. If the minimum measurable object size were twice the size of the individual measurement spot, then out of two closely spaced individual measurement spots, one will always be completely on the object. However, due to the presence of gaps in the sensor matrix (necessary for manufacturing) and the lens system not being free from imaging errors, in practice, it is common to multiply the above pixel size by 3 to determine the minimum measurable object size. For example, with a "standard" lens providing a 2 mrad geometric resolution, from a distance of 5 m, only objects (or object details) larger than 30 mm can be reliably and correctly detected thermally. For measuring smaller objects, either a shorter measurement distance or a different optics choice is required. By replacing the aforementioned "standard" lens with a telephoto lens, for instance, assuming a 0.5 mrad geometric resolution, objects as small as 7.5 mm can be thermally measured from a distance of 5 m.
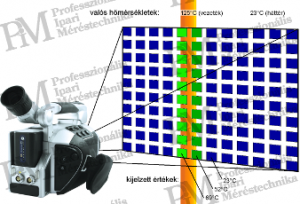
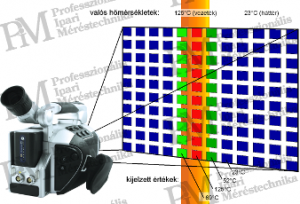
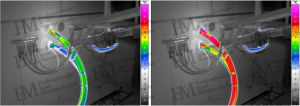
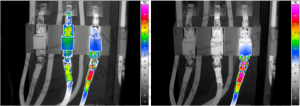
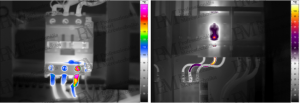
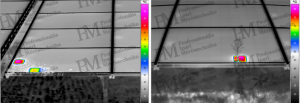
Figures 1-2 clearly demonstrate the measurement error and its magnitude when there is inadequate geometric resolution. While the upper image shows the actual temperature of a larger diameter wire in our thermal image (displayed maximum value 125°C), in the case of the lower image, we erroneously perceive the temperature of an equally hot but thinner wire (displayed maximum value 69°C). The following two thermal images confirm the risk of capturing an "overview" image with inadequate geometric resolution through a specific practical example. I believe further explanation is unnecessary. Images 5-6 illustrate the risk of capturing an "overview" image with inadequate geometric resolution through a specific practical example. While in the image 10, the loose contact appears with a temperature of just 38 °C and does not seem like a fault, in the image 11, based on a thermographic detailed image with adequate geometric resolution, it turns out that its actual temperature is over 58 °C (a 20 °C measurement error)!

Our situation is not simple due to the insulation of electrical train components. Since on plastic layers as thin as half a millimeter almost no heat radiation can pass through, enabling the measurement of electrical equipment, it is completely obvious that plastic covers concealing the elements to be measured must be removed before measurement. This applies to covering plates of fuses and miniature circuit breakers as well as to plexiglass covers inside cabinets for touch protection. However, what we definitely cannot remove in practice is the completely enclosed plastic casing of modern insulated components. In fortunate cases, the manufacturer left a small hole, 3 ... 4 mm in diameter, through which - from the appropriate viewing angle - the fault of the component or poor contact resulting in critical temperature inside can be observed. Of course, for fault detection through the hole, it is necessary to choose our maximum measurement distance according to the geometric resolution matching the hole size. (See the previously discussed issue.) And if there is no such hole for detecting internal problems on the cover, then we can only rely on good heat conduction of the electrical conductor. Examples shown in images 12-13 are quite reassuring in this regard, as in most cases the fault of the enclosed component or contact can be clearly correlated with the temperature of the outgoing conductor, which decreases as it moves away from the device in question.


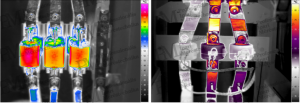
Finally, here is one more illustrative example drawing attention to the heat effects not visible thermally due to touch protection plexiglass surfaces. In the example, the real temperature of a loose contact visually detectable but thermally undetectable due to covering is 57°C. This would definitely justify maintenance intervention, unlike the seemingly acceptable 41°C value. (However, the phase difference is already sufficient reason for the necessity of inspection and maintenance, even in the case of acceptable values.)

It is generally a dilemma what pixel resolution a thermal camera should have. High-resolution (truly) professional thermal cameras with many pixels have good geometric resolution alongside a large field of view, making it possible to survey and document even larger switchgear cabinets with few images. On the other hand, thermal cameras with higher pixel count (larger detector) also come with significantly higher investment costs. Which thermal camera meets the measurement requirements while also being economical? Several aspects need to be considered to decide on this matter: 1. how often (perhaps repeatedly) are measurements conducted, 2. how many and how large switchgear cabinets do we have, and what is the smallest component or conductor to be observed inside them, 3. what and how should be documented? Based on our answers to these questions, we can roughly estimate how many on-site images are needed and then how many thermal images need to be evaluated. In case of special documentation needs, beyond simple note-taking, the montage of thermal images (time-consuming) might also become necessary. With a thermal camera of 1024x768 pixels (from an appropriate distance), a single image can survey a switchgear cabinet up to 0.5x0.7 m in size containing cables with a diameter exceeding 2 mm. Using this as a reference, the labor time required can be estimated as shown in Table 1.
| thermal camera detector pixel size | 1024 x 768 | 800 x 600 | 640 x 480 | 400 x 300 | 384 x 288 | 320 x 240 | 160 x 120 | 80 x 60 |
| on-site data recording time requirement |
1x |
2x |
3x |
8x |
9x |
13x |
54x |
225x |
| reporting time (without montage) |
1x |
2x |
3x |
8x |
9x |
13x |
54x |
225x |
| thermal image montage time requirement |
none |
1x |
2x |
3x |
5x |
6x |
12x |
96x |
| device cost (compared to reference) |
1x |
0.8x |
0.7x |
0.5x |
0.4x |
0.3x |
0.1x |
<0.1x |
Table 1: Relationship between thermal image pixel count and work requirement The selection of the appropriate thermal camera can be based on the following logic: choose the thermal camera whose price, ideally with the highest pixel count, is lower than the product of the work volume to be done (quantity of cabinets · measurement frequency · time multiplier) and the corresponding 3* annual labor cost. (3 years is half of the current technical obsolescence time of thermal cameras. This is not equal to the typical lifespan of the devices.) Choosing significantly more expensive ones would be wasteful, while opting for the "cheaper" ones would result in excessive labor costs. The thermal camera selected based on the above reasoning starts generating pure profit compared to its competitors with lower pixel counts from the third year onwards.
The image capture/image refresh rate is also a technical parameter that cannot be overlooked. Common microbolometer thermal cameras cover a wide range of image acquisition frequencies. A distinction is generally made between slow 9 ... 15 Hz, and faster 50 ... 60 Hz, and max. 240 Hz refresh rate thermal cameras. (There are even faster thermal cameras providing image acquisition frequencies up to 9 kHz, which, however, have photon detectors to achieve this speed.) With few exceptions, thermal processes usually have a large time constant, and if the object is stationary, the above (achievable with a bolometer) image frequencies are more than sufficient. However, very fast (transient) temperature processes or rapidly moving measurement objects may require significantly higher image frequencies for recording. For example, recording the heating process during the startup of an electrical device or the temperatures occurring during disconnection under load segmentation may require image refresh rates of several kHz. Serious problems may arise if detailed thermal images or even measurements at greater distances are to be taken with a handheld thermal camera. It is a known fact in photography that a steady-handed photographer can take blur-free photos even at a 1/60 shutter speed (without a tripod). An "amateur" with an unsteady hand may result in occasionally blurred images even at a 1/125 shutter speed. These shutter speeds correspond to 17 ms and 8 ms exposure times, respectively. What skill is required to capture motionless thermal images with just a 9 Hz thermal camera handheld! To achieve this, the thermal camera would need to be held motionless for up to 30 ... 40 ms! In other words, for handheld operation, only thermal cameras with integration times shorter than 15 ms, meaning a refresh rate of 50 Hz or faster, can safely capture blur-free thermal images.
The question often arises where to draw the line for the perceived heating to be considered faulty or even dangerous. Deciding on this issue is particularly difficult when thermographic surveys are conducted at significantly lower current levels than the maximum load. To avoid this problem, it is advisable to accept that thermographic condition assessments of electrical equipment should only be carried out when at least 50% of the rated load is present. Only very gross errors can be detected at 30% load. Accepted limit values and decision rules (at least 75% load): General limit values compared to ambient temperature Heating 20 K ... 40 K: to be checked Heating 40 K ... 60 K: to be checked urgently Heating >60 K: critical Limits for differences between phases Deviation 5 K ... 20 K: to be checked Deviation 20 K ... 40 K: to be checked urgently Deviation >40 K: critical (** between phases) Limits depending on insulating material: Rubber-insulated cables: max. 60°C PVC-insulated cables: max. 70°C Silicone-insulated cables: max. 180°C Other limit values: Electric motors (measured on cooling fins): depending on type and cooling conditions Insulation class "A" max. 60 ... 80°C Insulation class "B" max. 95 ... 105°C Insulation class "F" max. 115 ... 125°C Insulation class "H" max. 140 ... 150°C Plastic enclosures: depending on material max. 50 ... 75°C Magnetic switches: typically max. 85°C Transformers: typically max. 85°C Inside electrical cabinets (IEC/EN 60947-3): max. 35°C Busbars (DIN 43671): max. 65°C External metallic contacts (IEC/EN 60947-3): 80 K (compared to ambient) Insulated contacts (IEC/EN 60947-3): 70 K (compared to ambient) Note: Lower limits apply for all the above values at lower loads.
Heating occurs due to the energy loss in the form of heat resulting from the transient resistance of the examined electrical device (cable, rail, etc.). The device then dissipates this power through radiant heat, convection (towards the air), and heat conduction towards the connected elements. The expected heating under higher loads (be it current or voltage) is primarily influenced by the load- and temperature-dependent resistance change of the device (or contact). However, the simultaneously increasing - expectedly strengthening - heat conduction, radiant heat, and convective heat dissipation also affect the process. Accordingly, determining the resulting heating would require very complex mathematical relationships. In a steady state, the expected temperature in a (assumed to be infinitely long) rail or conductor depends on the object and ambient temperature, voltage, current, but also on many material properties. The latter include the current carrying capacity factor (temperature-dependent), the material-specific resistance (temperature-dependent), the radiation-based heat transfer factor, the convective heat transfer factor, as well as the cross-section of the conductor or rail. The equation encompassing all this is quite complex for practical application - especially due to the difficult-to-access material properties - we recommend using the following estimation instead.
Simplified heating estimation for nominal load Assuming that the temperature increase between the load at the time of measurement and the nominal load is so small that the temperature change of the material-specific resistance can be neglected, and neither the current displacement factor nor the heat transfer factors change significantly due to the observed device temperature increase, then all these factors can be considered constant in the equation above. (This can be applied in the case of a temperature increase of a few tens of degrees Celsius. However, these simplifications are not valid for larger changes, so the equations below cannot be applied.) Applying the above simplifications, we get the following equation:
Where: θtn ... estimated object temperature at nominal load θtm ... object temperature at the time of thermographic measurement θl ... environmental air temperature (assumed constant) Um ... voltage at the time of thermographic measurement Im ... current at the time of thermographic measurement Un ... nominal voltage In ... nominal current For network equipment (at a constant voltage level), we can use the following equation to estimate the expected absolute temperatures:
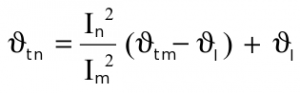
The estimated temperatures can then be compared with the limit values listed on the previous page. For network devices, Um and Un are constant, so the object temperature electrically depends only on the I² ratio.
Thermographic example recordings for conductors and electrical connections heating up depending on the load
Thermographic example recordings for contact faults / loose connections (high-power elements)

Thermographic example recordings for contact faults / loose connections (low-power devices)
Thermographic example recordings for contact faults / loose connections (terminal blocks, fuses)
Thermographic example recordings for different phase loads
Thermographic example recordings for undersized electrical equipment
Thermographic example recordings for undersized electrical conductors

Thermographic example recordings for cable lug/cable end sleeve faults
Thermographic example recordings for electric rotating machines and transformers

When it comes to the survey of overhead lines, in addition to the limitations of outdoor measurements, the geometric resolution is critical from a metrological point of view. For the measurement of the overload and transient resistance increase of ropes, even with a diameter of only 18 mm at a height of 30 m, a geometric resolution of 0.2 mrad or even better is required, hence a large "optically magnified" telephoto lens is necessary. Even some faults in insulators can still be detected with weaker geometric resolution. The following thermal images are unsuitable for thermographic evaluation due to both the time of measurement and the visible geometric resolution. Regardless of whether they were taken from the ground or from the air (by helicopter, plane, or drone). (Unfortunately, these examples are typical for the majority of overhead line surveys currently being conducted, with hardly any accurate measurements among publications and promotional materials!) Thermographic sample images of electrical overhead line faults
![left: overhead line with fault [source: Infratec]; right: drone detail (based on [Workswell])](/images/4024/mee12-300x103.png)
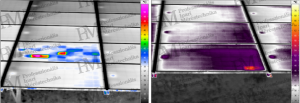
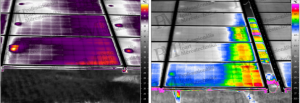
One of the youngest but presumably rapidly growing applications of thermography is assumed to be the quality control during solar cell manufacturing and the condition monitoring of installed modules or even entire solar power plants. While, for example, U-I characteristic curve checks clearly indicate problems and efficiency degradation, most types of faults and fault locations cannot be detected this way, even when modules are disassembled. In contrast, thermography, assuming proper execution, can localize faults and distinguish between various different fault phenomena. Especially in the case of large solar cell parks, this enables efficient operation and cost-effective maintenance. When inspecting solar cell systems, evaluation templates and threshold values used for electrical equipment surveys apply to connections, cabling, distributors/collectors, regulators, and converters. However, these cannot be applied to the cells or modules themselves. Therefore, in this chapter, we specifically focus on the theoretical background and practical knowledge required for solar cells. General Information on Solar Cell Measurements The main difference compared to the thermographic applications presented so far is that intensive sunlight is required for outdoor measurements. This is completely contrary to the emphasis we usually put on avoiding thermographic measurements in sunlight and especially when the object being measured is directly exposed to sunlight. This is to avoid the reflection of sunlight and the heating of the object. However, in the case of inspecting solar cell systems, sunlight is precisely needed for the temperature differences caused by fault phenomena to appear. The observation of these requires careful selection of the observation angle to counteract the reflection of sunlight on glass surfaces. Typical Application Conditions, Measurement Settings • operating solar cell system in energy production mode • minimum continuous solar irradiance of 600 W/m2 • maximum 2/8 Cumulus cloud cover, light cumulus clouds • rain- and snow-free conditions, no water or snow on the cells • up to 4 Beaufort (20 ... 29 km/h) wind speed (= moderate breeze) • ensuring proper field of view and geometric resolution • providing photographic and GPS-coordinate documentation for larger systems Typical Faults Detectable by Thermography
Thermographic Inspection of Large Solar Systems Using Drones The nature of the measurements listed in the introduction, the quantity of related recordings, and the difficulties related to field of view and viewing angle specifically lead to the application of aerial thermography. A typical example is thermographic surveys from airplanes or helicopters in environmental protection, environmental monitoring (e.g., for water management, agriculture, or wildlife monitoring), and large-scale archaeological and geological research. The aerial inspection of solar systems, especially of large-scale, multi-hectare photovoltaic power plants, is becoming increasingly common, facilitated by the appearance of drones with higher payload capacities and easier application, even capable of automation. (Of course, it should not be forgotten that the use of drones is subject to strict regulations, legal regulations, and additional technical and legal risks.)

With a thermal camera of adequate resolution and correct parameter settings (measurement frequency, observation angle, as well as flight altitude and speed), the quality (evaluable) thermal images shown in the following figure can be obtained. The complexity (and interaction) of the requirements and parameters is so multifaceted that it is unfortunately not possible to discuss this within the scope of this presentation (or article).

Thermographic sample images of faults in photovoltaic systems

The source of the (abbreviated) text and thermal images: Eric Rahne: THERMOGRAPHY - theory and practical measurement technology 656 pages (A4, color), 303 figures, 452 images, 754 thermal images, 50 tables ISBN 978-963-87401-6-8 (printed book, no electronic edition) For more information: www.termokamera.hu Eric Rahne (PIM Ltd.) pim-kft.hu, termokamera.hu
The content of the publication is protected by copyright, and its (even partial) use, electronic or printed re-publication is only allowed with the indication of the source and author's name, as well as with the author's prior written permission. Violation of copyright (Copyright) will have legal consequences.
Copyright © PIM Professzionális Ipari Méréstechnika Kft.
2026 | Minden jog fenntartva
Impresszum | Adatkezelés