


Eric Rahne, B.Sc. in Electrical Engineering, Level 3 Accredited Thermography Expert (PIM Ltd.)
As wide as the possibilities are for condition assessment and maintenance organization of off-grid systems or photovoltaic power plants with the regular application of thermography, just as many difficulties arise during the implementation of measurements. In our article, we address some significant problems and provide advice on minimizing the extent of measurement errors.
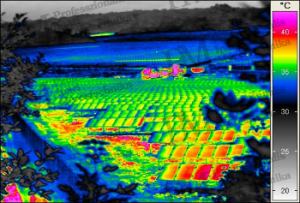
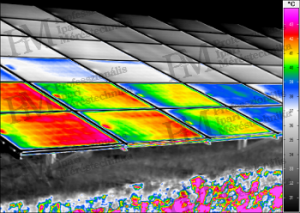
The biggest issue arises from the measurement object, more precisely from its glass cover, and the measurement period conducted in glaring sunlight. Considering what has been discussed earlier about thermographic measurements, we already know that due to the temperatures to be measured, it is advisable to choose a long-wave thermal camera. For surfaces with glass covers to be measured, medium-wave thermal cameras with appropriate filters would be ideal due to their emissivity properties, but the temperatures to be measured are too low for this. Moreover, medium-wave photon detector thermal cameras are also quite expensive. Therefore, for the assessment of electrical equipment, long-wave spectral range bolometer thermal cameras suitable for positioning are usually chosen. Of course, knowing that the observation angle will strongly influence our measurement results. Finding the appropriate observation angle is very difficult when assessing photovoltaic systems. The long-wave reflection of glass can reach up to 25%, making sunlight, the sky, and even the radiant heat of the person conducting the measurement significant sources of disturbing radiation depending on the viewing angle. The effect of reflection depending on the viewing angle is well illustrated in Image 1.
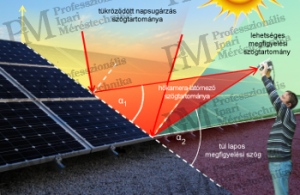
During measurements, the solar cells to be measured should not be shaded for an extended period, which can be a serious problem with stand-based or aerial lift solutions. Therefore, to avoid measurement uncertainty and the recording of ambiguously interpretable thermograms, the observation angle must be chosen very precisely. This requires taking into account the sunlight occurring during the measurement, which varies in terms of altitude and lateral angles depending on the season and time of day. Considering all this, it can be assessed which solar modules can be observed depending on the height positioning of the thermal camera. It is easy to understand that at a height of 1.5-1.7 meters, with a handheld camera, there is hardly any chance of correctly observing the upper modules of large module tables stacked on top of each other. In the position shown in Image 2, observing the upper module in this way is already impossible.
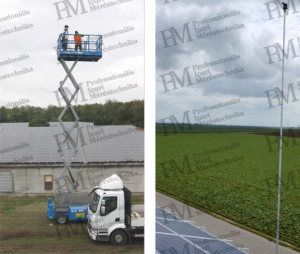
It is no wonder, therefore, that various methods have become popular to increase the height of the thermal camera's position, including the use of drones for inspecting photovoltaic systems. Images 3-4 provide insights into current ground-based inspections. We have already covered aerial inspections in a previous article.
Another significant problem is related to the geometrical resolution of thermographic measuring devices. It is not true that compared to other thermographic applications, a smaller geometrical requirement is sufficient to make thermography more cost-effective in solar systems. To accept this, we would have to acknowledge that we will only detect the large surface area problems, not every single fault. Consequently, heat effects indicating cell-level interconnections and solder points may go unnoticed. This raises the question whether an expensive inspection is truly economical if it does not cover everything. Even if it is more costly, it is still worth conducting a comprehensive inspection rather than a partial one at half the price. Costs are also incurred for detecting other faults, and the expected production may still fall short of expectations, which can also lead to significant losses. Instead of further generalities, let's focus on the facts of measurement technology. The primary consideration is the typical heat effects of what spatial extent are the typical fault phenomena? Damage to a cell, its complete failure leading to resistance heating proportional to its size. A partial break results in a proportionally heated surface, a contact box contact or bypass diode fault triggers a heat effect proportional to the contact box size. The smallest heat effects are caused by a cell contact-interconnector fault or a local short circuit within a cell. Considering that the few millimeters of glass cover have both perpendicular and lateral heat conduction, even the smallest faults have heat effects with a surface area of at least 25×25 mm.


According to the basic rules of thermographic measurements, the necessary geometrical resolution should always be determined considering the dimensions of the smallest surface area of the fault. In our case, this requires an ideal measuring spot size of 8 mm, which translates to a geometric resolution of 1 mrad from a distance of 8 m. Based on the 640×480 pixel resolution of thermal cameras currently available at an acceptable price, this allows for the measurement of approximately 12 pieces of 1×1.6 m modules in a single capture. Considering that MW-sized photovoltaic power plants consist of more than 4000 modules, assuming closely arranged modules, this necessitates the creation of over 400 thermal images. While the above calculation aims for a 100% detection of all types of faults, a study by a German company confirmed that with a 30% hit rate, even a 6×6 pixel per cell is sufficient. This corresponds to an ideal measuring spot requirement of approximately 24 mm, resulting in a geometric resolution of just 3 mrad from 8 m distance. However, it is up to the reader to decide whether to opt for a "cost-effective" survey with a 30% hit rate instead of a full 100% hit rate survey at the expense of triple the number of thermal images. Especially considering that a more rigorous inspection usually does not exceed twice the cost of a compromise survey.
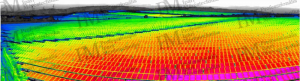
The increasing quantity of the aforementioned measurements and the difficulties related to the field of view are increasingly leading to the aerial survey of solar systems, primarily large-scale, multi-hectare photovoltaic power plants. The emergence of drones with increasing payload capacity and easier application, even capable of automation, provides a good opportunity for this purpose. However, it is important to note that the use of drones is subject to strict regulations and legal requirements, which may entail additional technical and legal risks. When organizing missions, consider the duration of drone refueling and battery replacement, as well as the time needed for data download and memory card replacement. Additionally, be prepared for the fact that proper thermographic evaluation is linked to adequate solar irradiance, which depending on the calendar date, can impose strict time constraints. In the example below, only 10 hours to 15:30 hours of necessary irradiance was available, which, after deducting the mission's time requirements, allowed for exactly 8 half-hour flights. Assuming favorable weather conditions and solar system operation, after careful organization of the inspection schedule and individual drone missions, data acquisition can be followed by data evaluation. It is useful to capture visual images alongside thermal images, preferably synchronized and possibly with GPS coordinates. In the case of many identical modules and module tables, without this, it is easy to confuse the "geographical" locations of measurement data, potentially undermining the targeted maintenance support nature of the inspection. If GPS coordinate recording is not possible, it is advisable to place a clear, large-sized serial number or other marking at the beginning of each new row, which allows for the identification of the row in both thermal and visual images. This could be a matte painted number on a bright white background, or a symbol made of a few aluminum foil strips or Roman numerals. With the right software, the panoramic stitching of thermal images can be almost automated, greatly aiding error analysis and presentation. This concludes our series of articles. In the eight parts published on the subject, we aimed to provide insights into the incredible versatility of thermography, its theoretical and practical limitations, drawing from the author's 650-page book "Thermography - theory and practical measurement technology." Eric Rahne (PIM Ltd.) pim-kft.hu, termokamera.hu
The content of this publication is protected by copyright. Any (partial) use, electronic or printed re-publication is only allowed with the indication of the source and the author's name, and with the author's prior written permission. Violation of copyright (Copyright) entails legal consequences.
Copyright © PIM Professzionális Ipari Méréstechnika Kft.
2026 | Minden jog fenntartva
Impresszum | Adatkezelés